
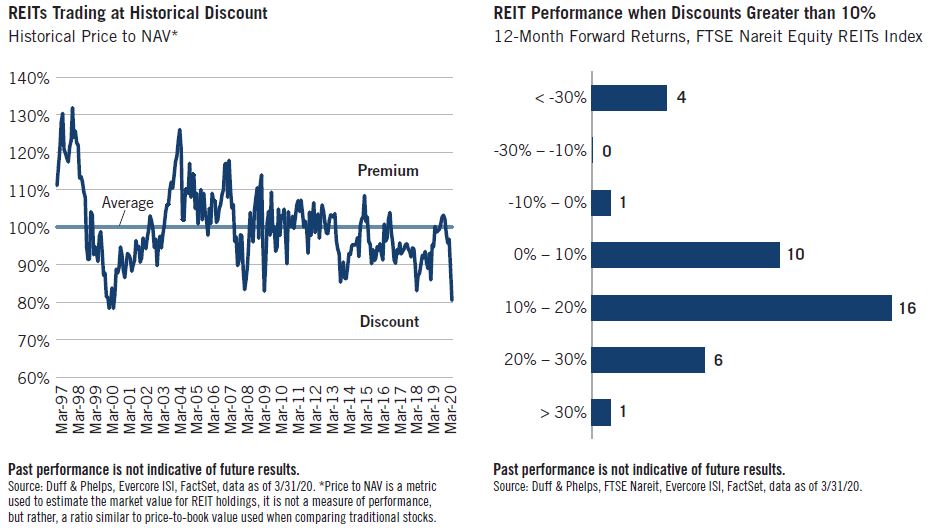
U.S. REITs have historically provided compelling returns when discounts to NAV were greater than 10%.
Not unlike other asset classes, large drawdowns have historically led to higher future return potential. Since 1996 whenever the price-to-net asset value (“NAV”) for REITs has been at a discount of greater than 10%, the returns for the FTSE Nareit Equity REITs Index in the following 12-months were positive 33 out of 38 periods.
-
U.S. REITs were trading at a 30%+ discount to NAV in mid-March, and while the discount narrowed to 19% at quarter-end, it was still larger than during the Global Financial Crisis (GFC) in 2008-09. On average, REITs have historically traded at 100% of their price-to-NAV.
-
Previous crisis lows included a discount to NAV of 22% at the end of the dot.com bubble in December 1999; 17% in the GFC in February 2009; and 15% in the Taper Tantrum of August 2013. Had an investor purchased REITs during these three periods, their 12-month forward returns would have been 16.51%, 85.47%, and 19.35%, respectively.
-
The median return for the 38 periods measured was 21.07%, compared to the 10.89% return since inception of the FTSE Nareit Equity REITs Index.1
-
We do not believe the current market resembles 2008-09. Since then, REITs have strengthened their balance sheets and are better positioned today with lower leverage.
-
Less than 10% of REIT’s debt comes due in the next two years, mitigating the need to refinance at a time when credit markets have been disrupted.2
-
The world’s major economies have taken decisive action and launched fiscal and monetary stimulus that is without peacetime precedent to support the financial system.
-
Active managers have the flexibility to overweight those securities and sectors they deem most attractive and underweight those that are highly impacted in the current environment.
Past performance is not indicative of future results. Different periods or points in time will produce results that vary.
1Index inception date is 12/31/1971. Performance data of the FTSE Nareit Equity REITs Index through 3/31/2020. The high and low 12-month returns were both recorded during the GFC, -59.69% and 85.47%. Performance shown is not indicative of any Duff and Phelps product.
2Source: S&P Global Market Intelligence.
This material has been prepared using sources of information generally believed to be reliable; however, its accuracy is not guaranteed. Opinions represented are subject to change and should not be considered investment advice or an offer of securities. Forward-looking statements are necessarily speculative in nature. It can be expected that some or all of the assumptions or beliefs underlying the forward-looking statements will not materialize or will vary significantly from actual results or outcomes.
INDEX DEFINITION
The FTSE Nareit Equity REITs Index is a free-float market capitalization-weighted index measuring equity tax-qualified real estate investment trusts, which meet minimum size and liquidity criteria, that are listed on the New York Stock Exchange, the American Stock Exchange and the Nasdaq National Market System. The index is unmanaged, its returns do not reflect any fees, expenses, or sales charges, and it is not available for direct investment.
FTSE International Limited (“FTSE”) © FTSE 2020. FTSE® is a trade mark of the London Stock Exchange Group companies and is used by FTSE International Limited under license. Nareit® is a trade mark of the National Association of Real Estate Investment Trusts (“Nareit”). All intellectual property rights in the FTSE indices vest in FTSE and Nareit. Neither FTSE nor its licensors accept any liability for any errors or omissions in the FTSE indices or underlying data. No further distribution of FTSE Data is permitted without FTSE’s express written consent. All indices, trademarks and copyrights are the property of their respective owners.